WIP: Bairui Su
Today's tool help shape tomorrow's creativity.
I'm digital creative toolmaker who is interested in data visualization, creative coding, and interactive systems. Recently, I'm working on my thesis project Recho Notebook for ITP (Interactive Telecommunications Program) at NYU, which has been accepted by CHI 2026!
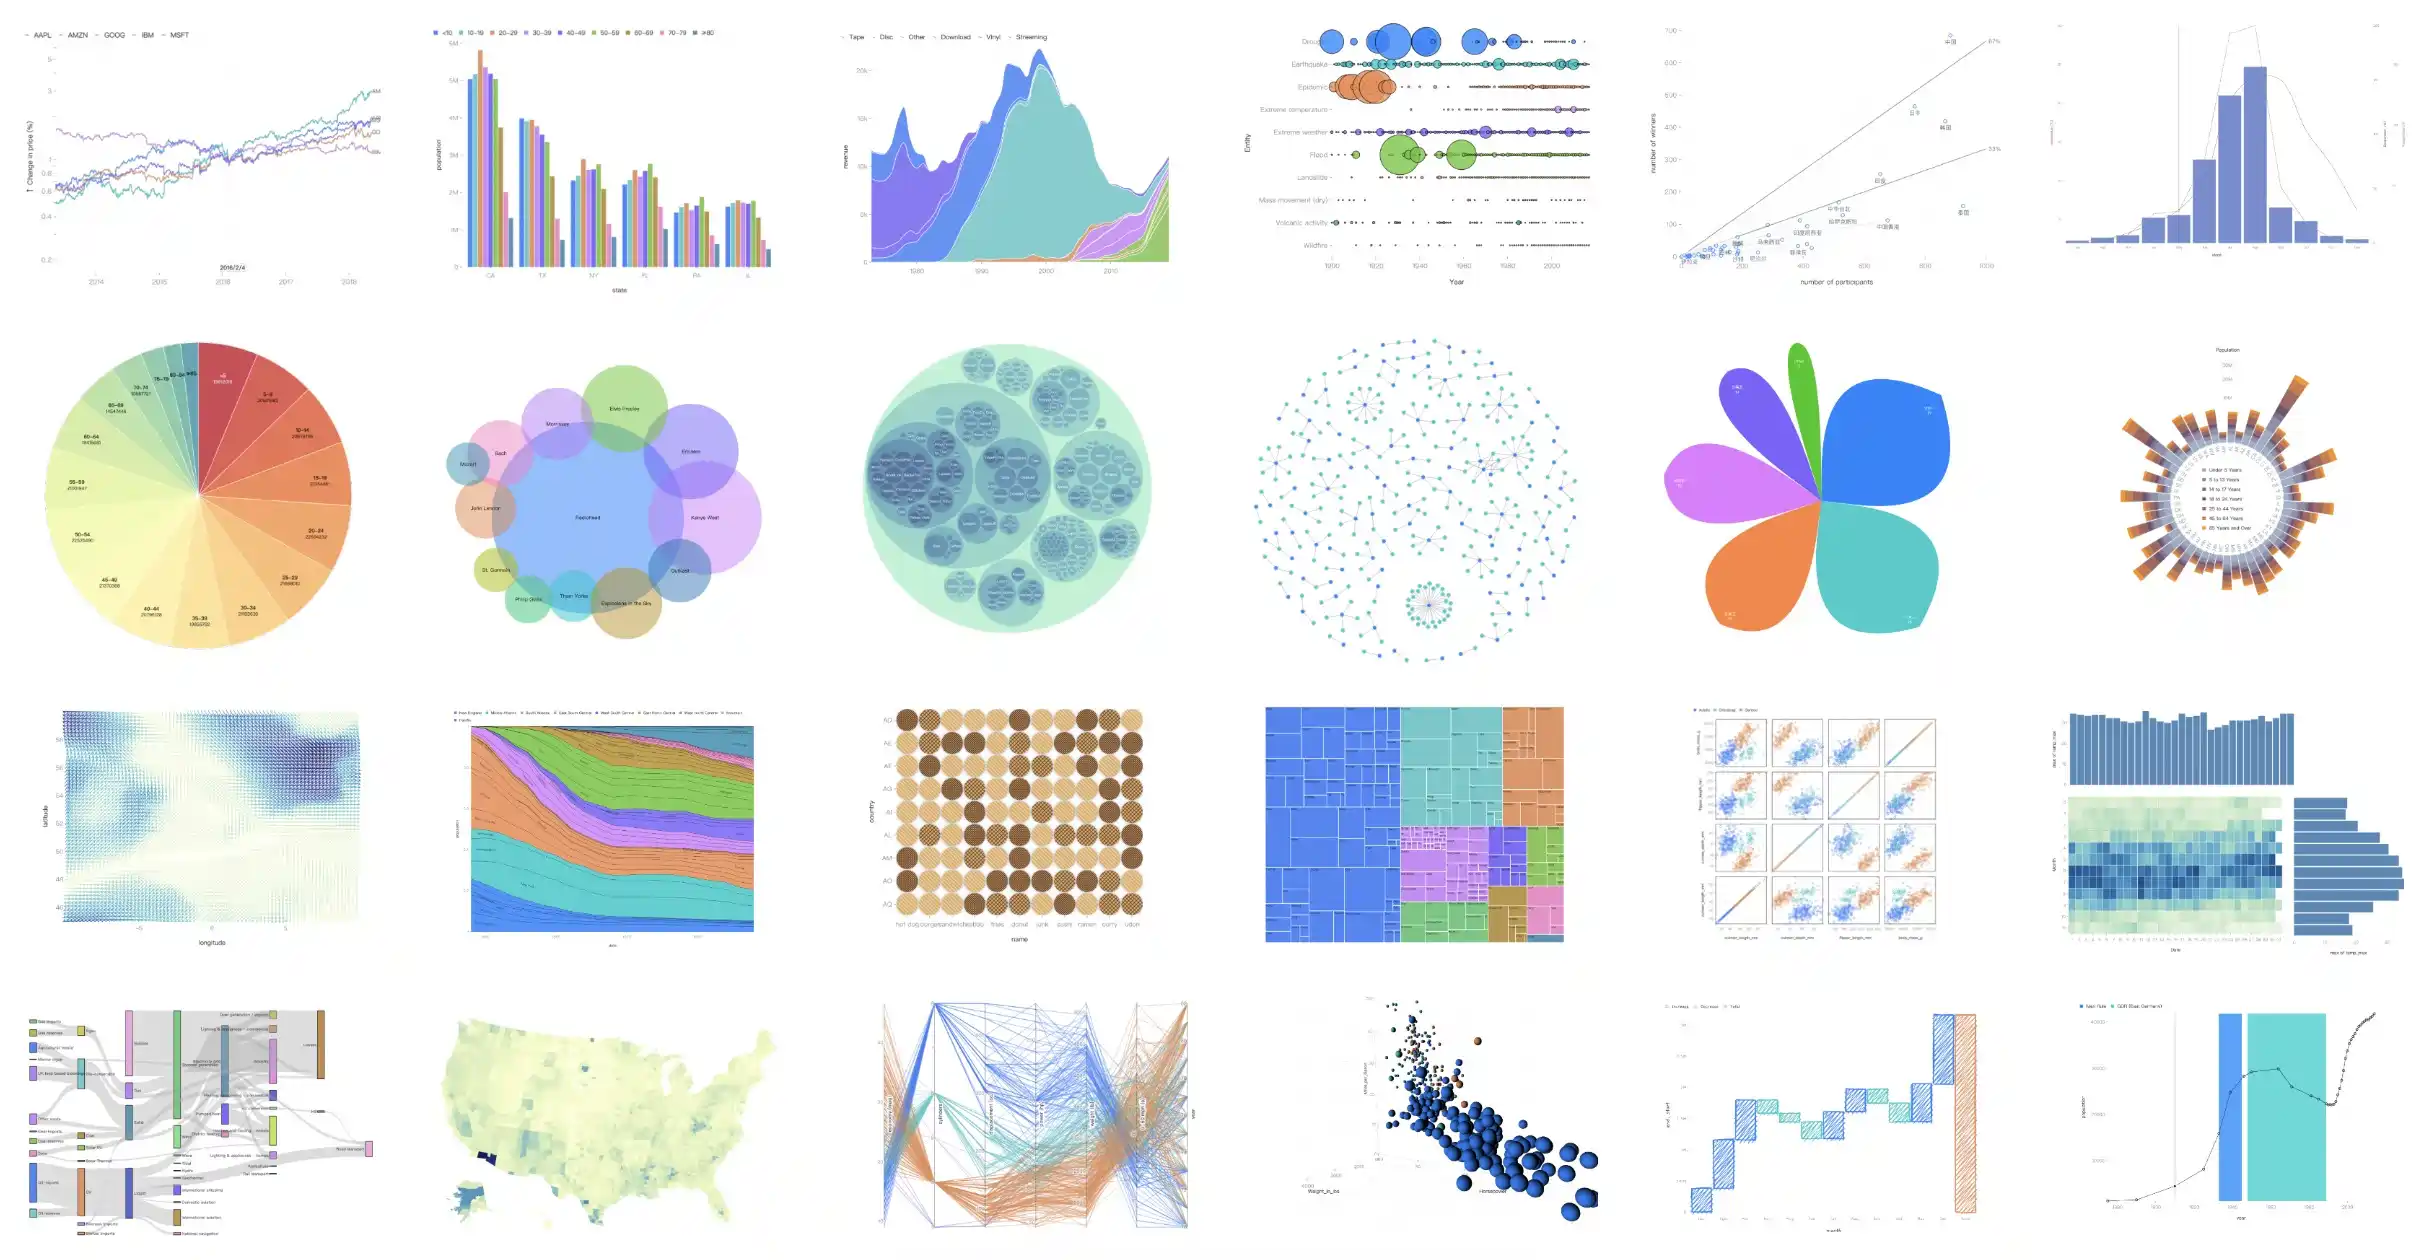
I used to be a software engineer (data visualization developer) at Ant Group, where I led the development of AntV G2 5.0, an open source JavaScript framework for interactive and exploratory visualization.
Email me at subairui@icloud.com or find me on: Github, Observable, Instagram, Medium, LinkedIn, Juejin, and OpenProcessing.
Featured
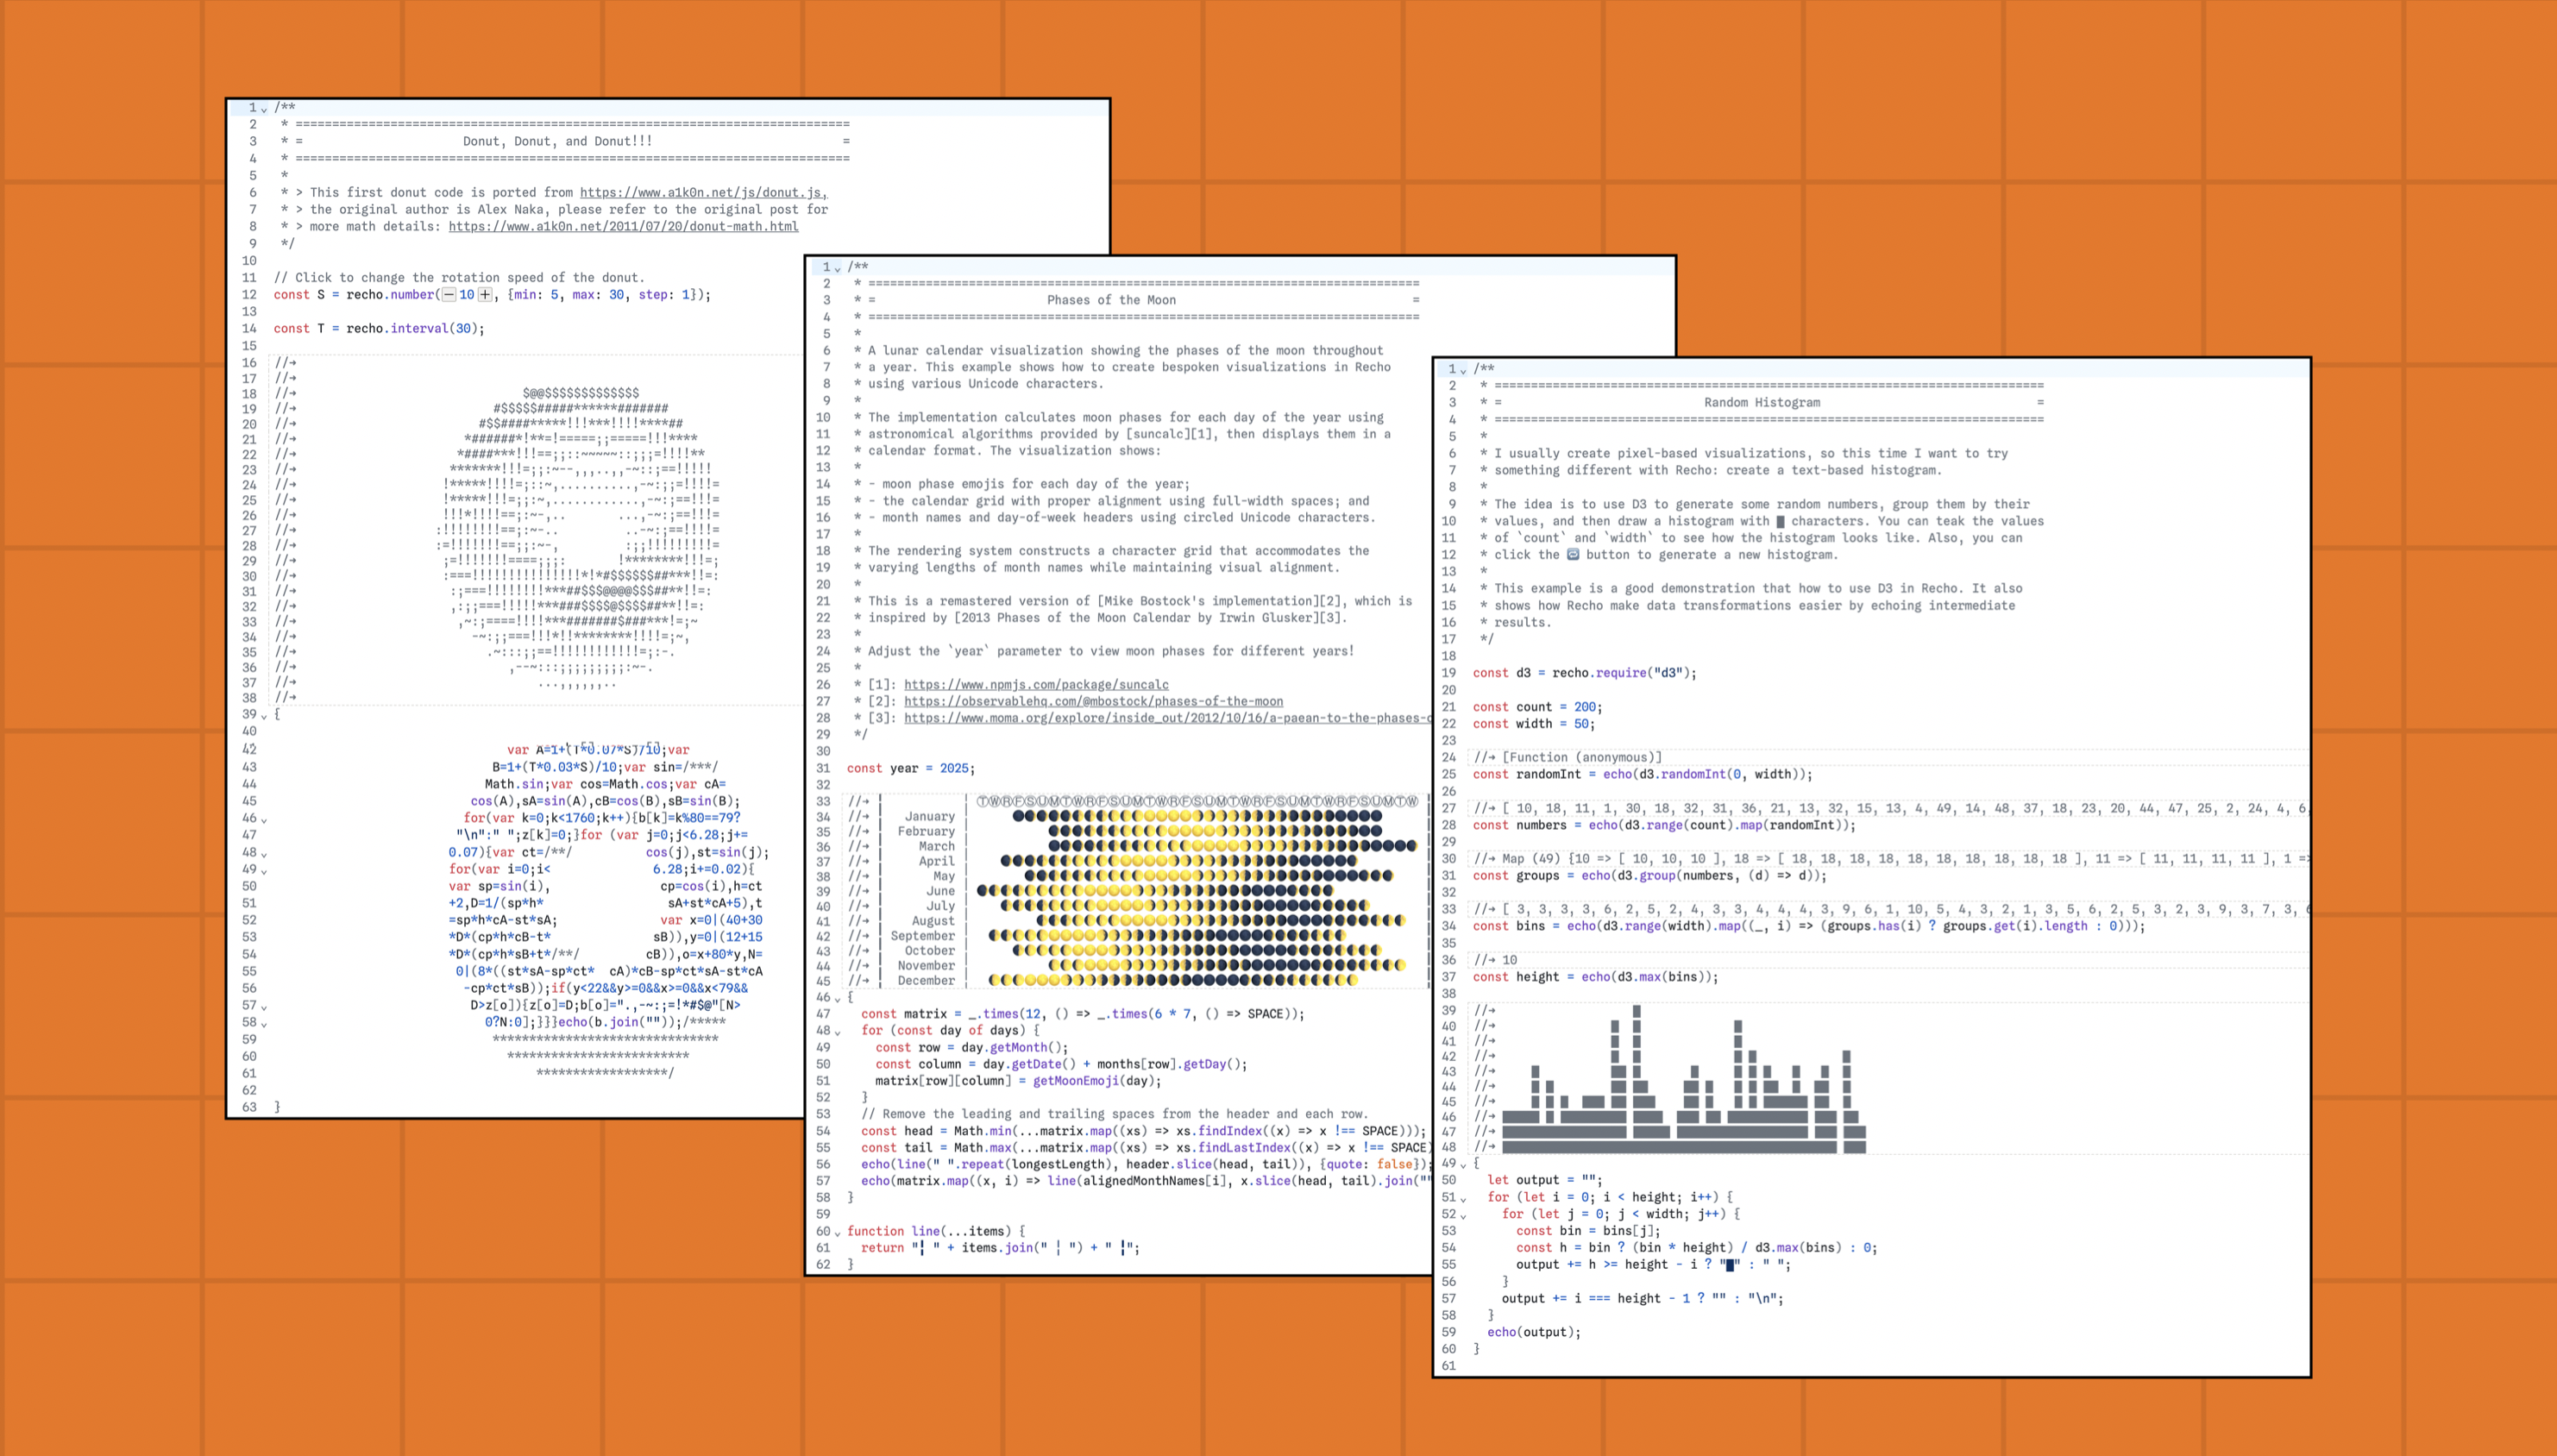
A lightweight, text-first notebook environment that explores programming as a medium for learning, exploration, and creative sketching.
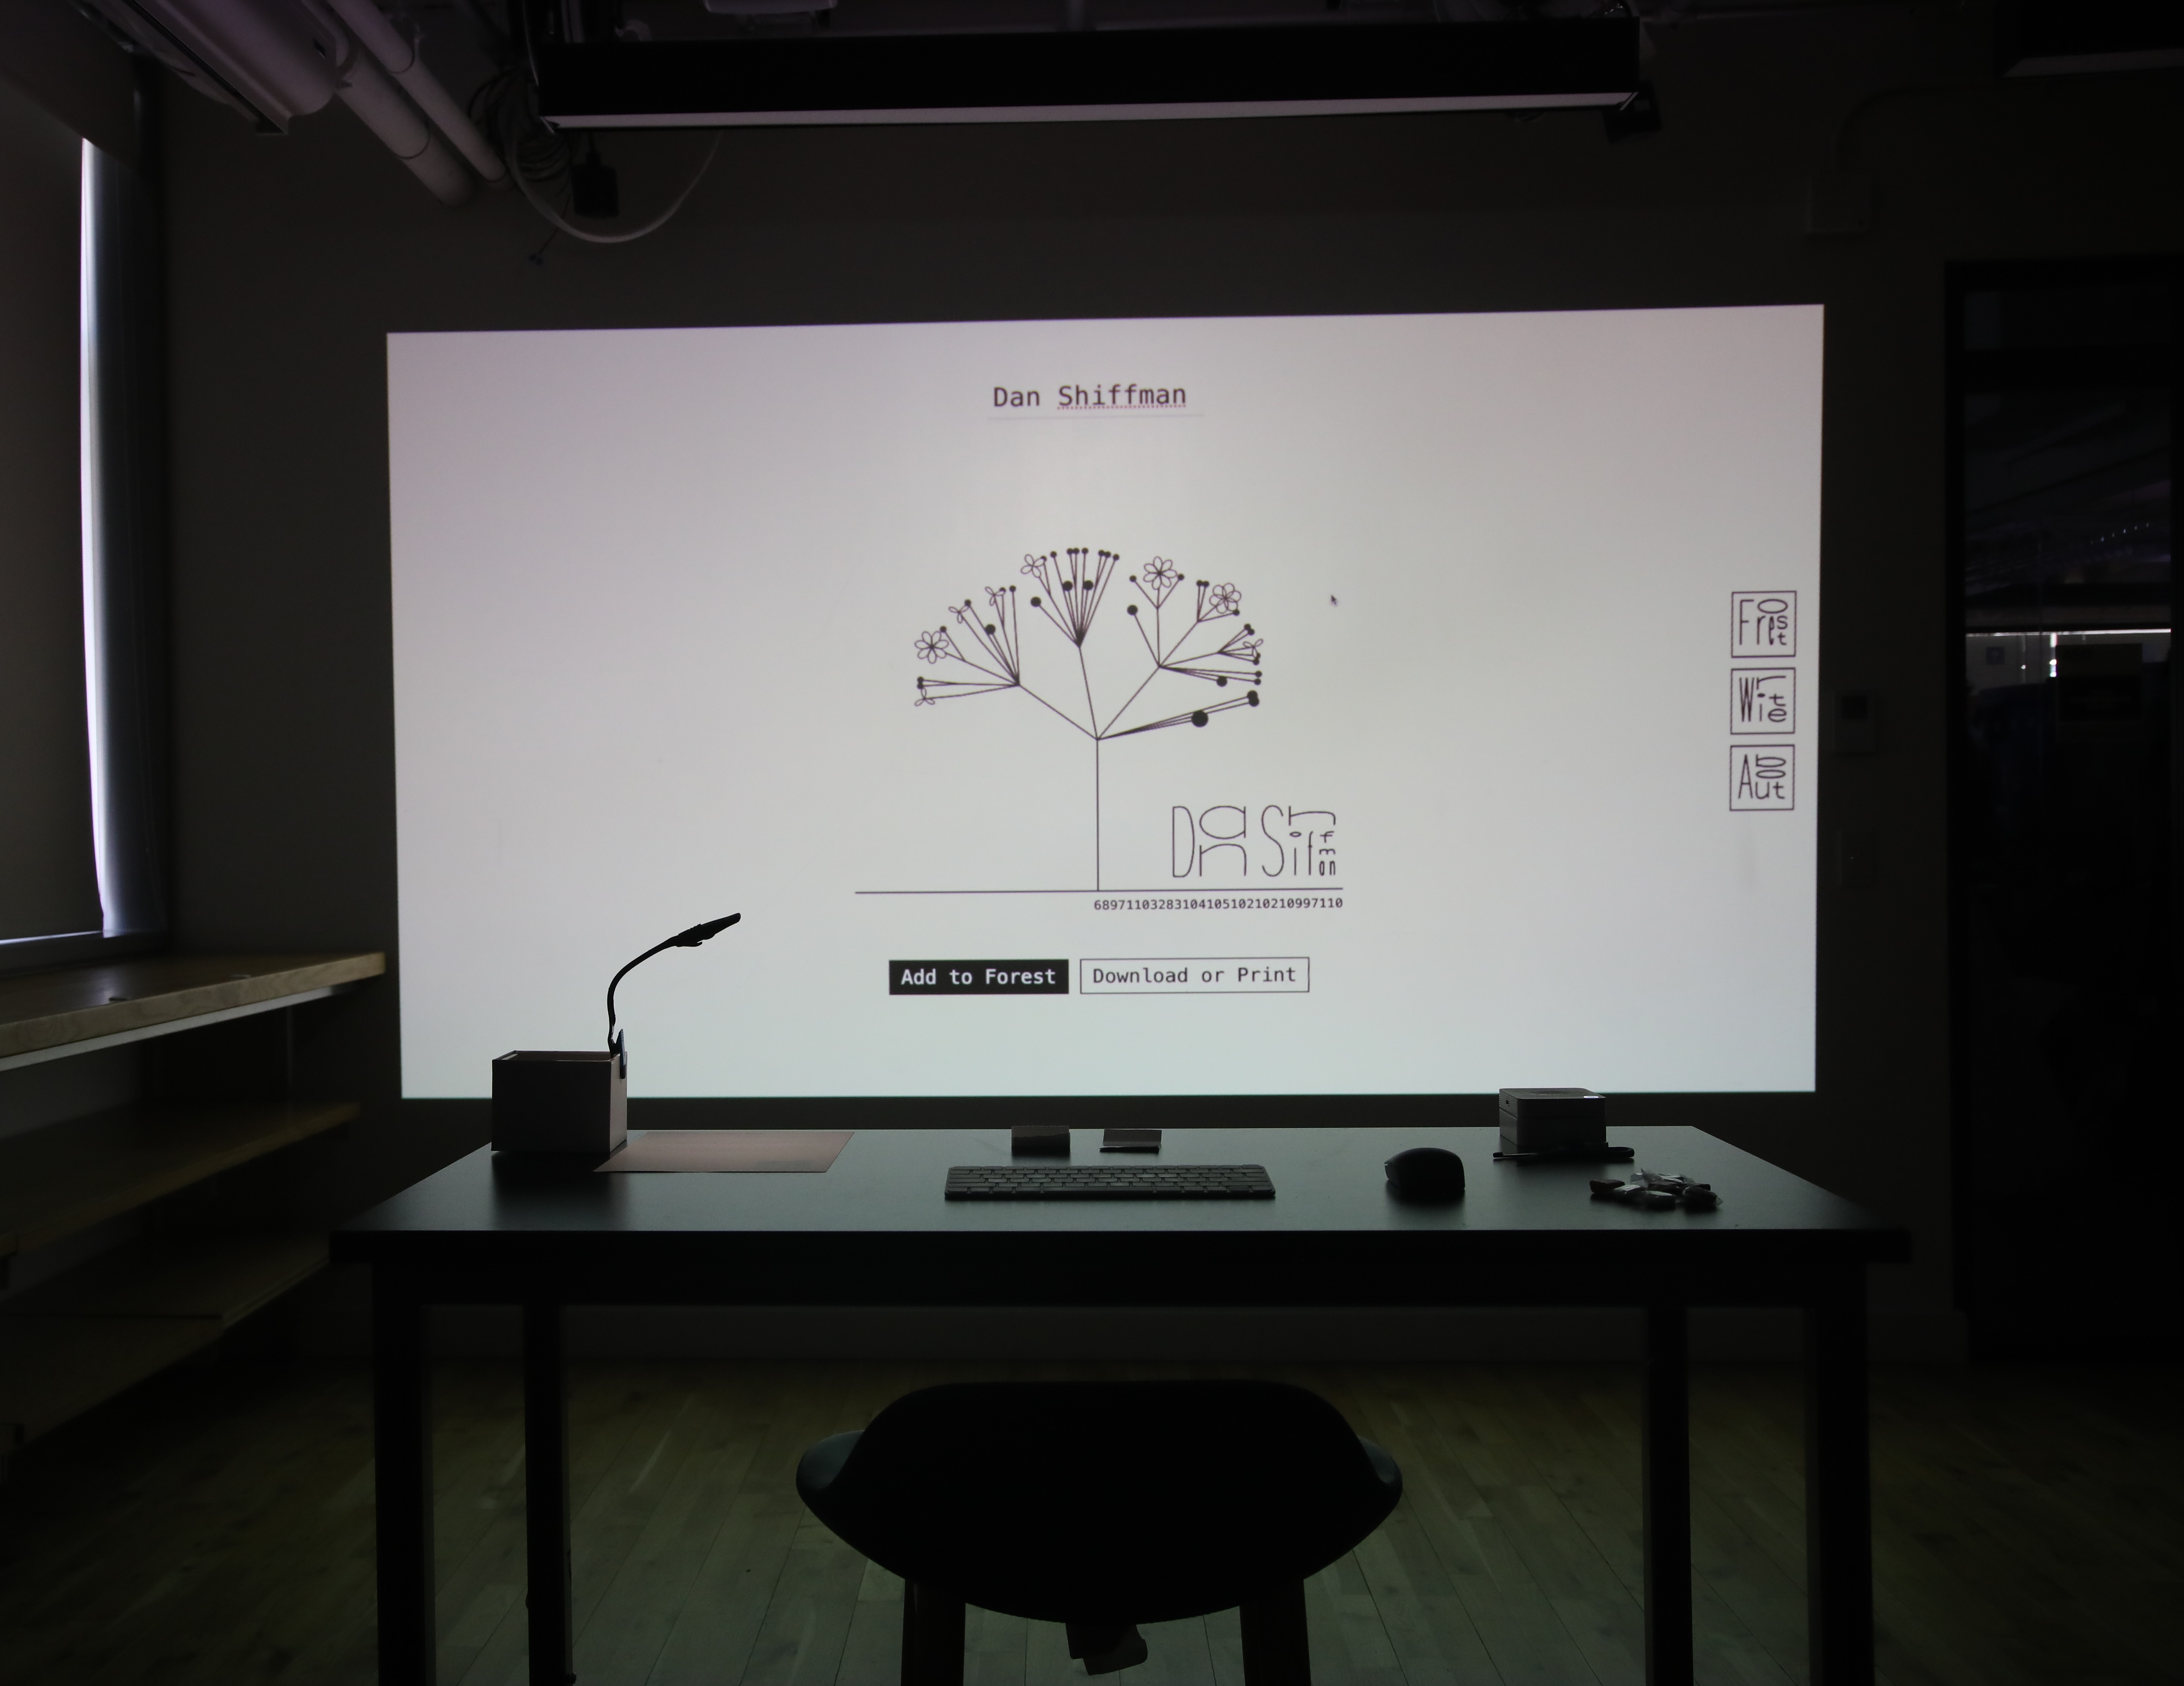
A collective generative art installation that procedurally transforms names into trees.
A JavaScript library for interactive data visualization.
An open-source platform for quickly authoring and delivering concise, impressive presentations.
Projects
A procedurally generated infinite landscape created collectively from names and trees.
An exploratory code environment for creative coding that enables parameter variations inspired by small multiples in data visualization.
A live coding piano editor that merges code, music and visuals into one performative instrument.
A lightweight, text-first notebook environment that explores programming as a medium for learning, exploration, and creative sketching.
A writing system that procedurally writes English alphabets in the style of Chinese Characters.
A collective generative art installation that procedurally transforms names into trees.
A JavaScript library for interactive data visualization.
An open-source platform for quickly authoring and delivering concise, impressive presentations.
My journey starts here.
This section is a work in progress, please refer to my portfolio page for more projects.
Experiments
A collection of generative art pieces from daily learning and experiments based on Genuary prompts.
A WebGL-powered platform that transforms images into generative artwork by visualizing classic algorithms.
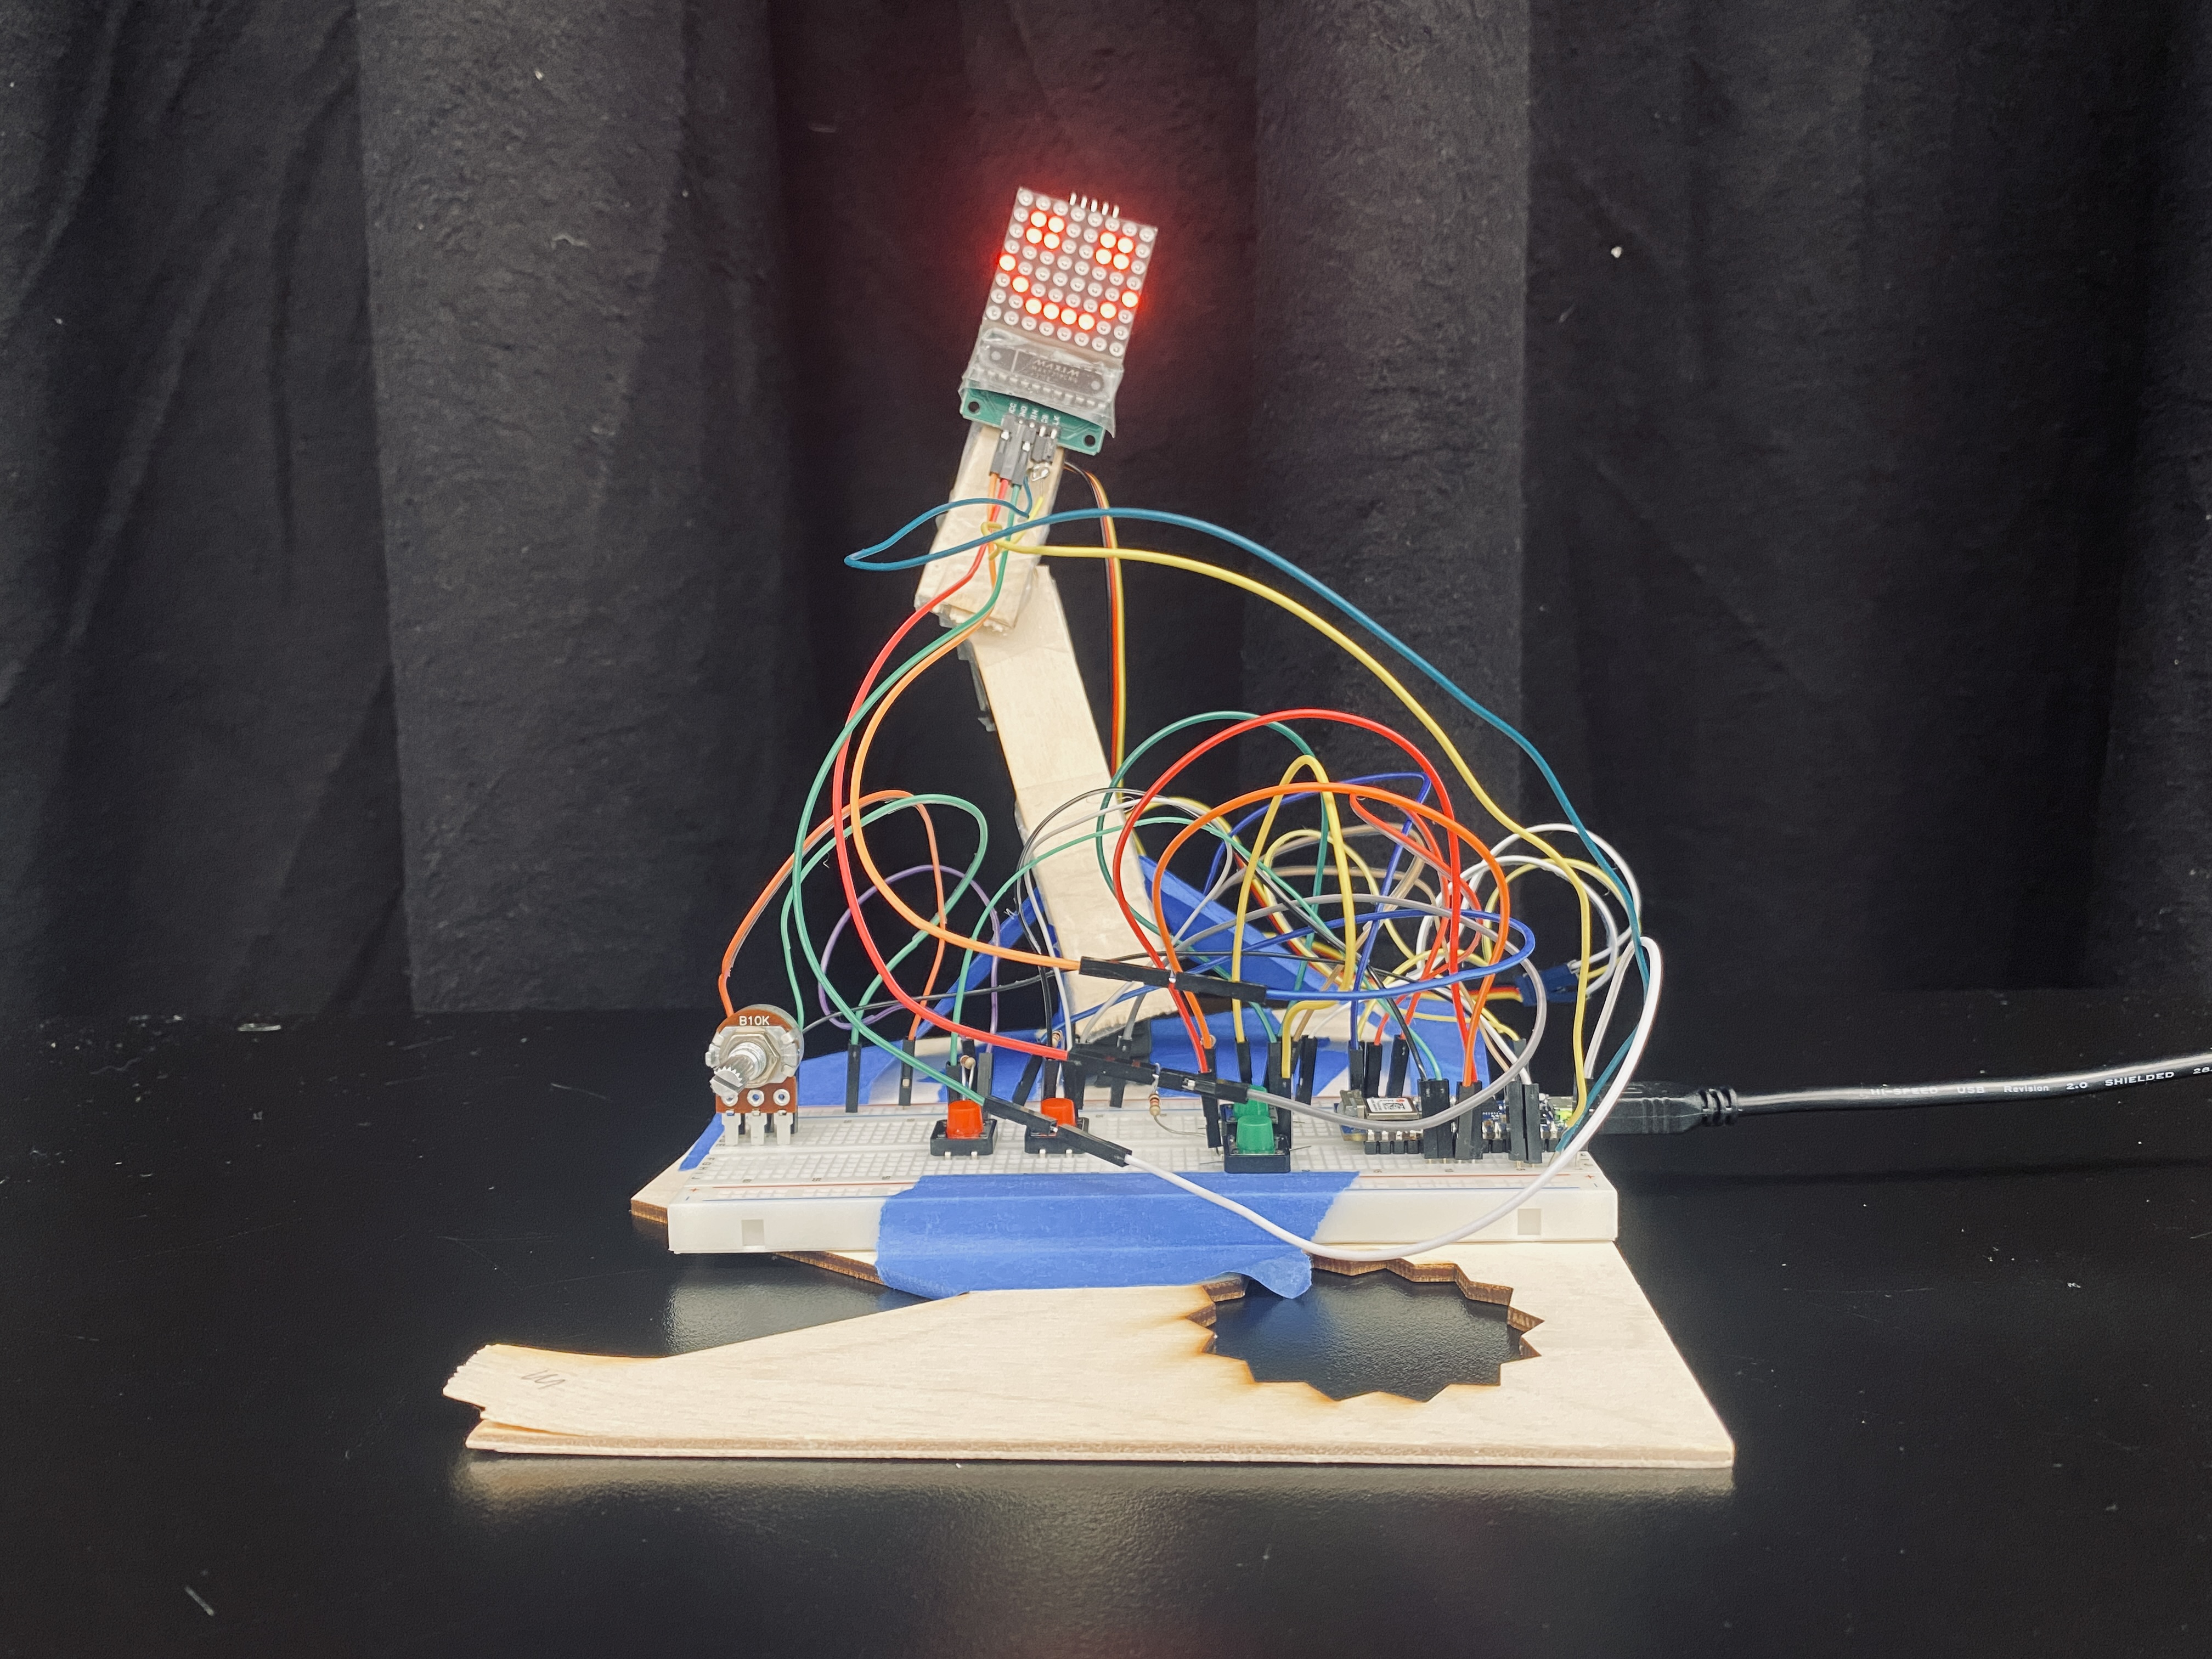
A simple robotic arm with a smiling face and a digital twin, built from discarded materials.